CS 3113 Fall 21
This is the web page for Operation Systems at the University of Oklahoma.
CS 3113 Fall 2022 – Introduction To Operating Systems
Assignment 6
The goal of this project is to observe and understand the performance of Semaphores across kernel execution elements.
You will also get a better understanding of the pthread libraries and build for intuition of the performance of threads.
Take code and modify it to take N threads in addition modifying the num-loops parameter.
Start early this code takes a long time to run!!
Getting started
This code is located here for downloading and in the Linux Programming Interface Textbook code as tlpi-dist/psem/.
You may also located it with the find command.
By default, the code only executes two threads.
Change the code to make this program use an arbitrary amount of threads to perform the counts.
You should be able to run it with the following usage: ./thread_incr_psem 1000 4.
In that example the code will run 1000 loops over 4 threads.
The starter code is available here here for downloading.
We will use the time to capture the performance times for several arrangements of threads and loops.
Install the updated version with sudo apt install time. For more information about the time command, see this website: https://www.lifewire.com/command-return-time-command-4054237.
You also need to install the following programs on your instance:
sudo apt-get install -y time tmux sqlite3 libsqlite3-dev
sudo apt-get install -y libsqlite3-0 libsqlite3-0-dbg
sudo apt-get install -y python3 ipython3 python3-pip
sudo apt-get install -y python3-tk ssh
pip3 install --upgrade pip
pip3 install pip pandas numpy matplotlib
Installing the packages above will allow you to execute this assignment requirements. In this assignment you will use python scripting, database scripts, and command-line. Examining the code may be helpful for you.
Running the Program: runtest.bash
Use the runtest.bash script to gather the data for your experiment.
The script (located below) or at this link will run your code with the following combinations of threads and loops.
- Threads: 2, 4, 8, and 16 threads
- Loops: 20000000, 40000000, 80000000, and 160000000
The runtest.bash script takes the executable name and the name of a csv file for output.
For example, you can run this code using the command: bash runtest.bash ./a.out experiment`date +%Y%m%d%M`.csv.
In this case, a.out is the name of the compiled thread_incr_psem.c code.
The ./ is nessary to let the script know that a.out is an executable.
Be sure that your runtest.bash file is executable (chmod u+x runtest.bash).
You could download the runtest.bash file, of you could include the commands below in a script file with the name runtest.bash.
#!/bin/bash
## Usage: bash runtest.bash ./code experiment`date +%Y%m%d%M`.csv

EXE=$1
CSVFILE=$2
CORES=$(grep -c '^processor' /proc/cpuinfo)

userhome=$(eval echo ~$user)

for threads in 2 4 8 16
do
  for loops in 20000000 40000000 80000000 160000000
  do
    /usr/bin/time -f "$CORES, $loops, $threads, %e, %U, %S" \
        --append --quiet --output=raw_$2 \
        $1 $loops $threads
    /usr/bin/time -f "$CORES, $loops, $threads, %e, %U, %S" \
        --append --quiet --output=raw_$2 \
        $1 $loops $threads
    /usr/bin/time -f "$CORES, $loops, $threads, %e, %U, %S" \
        --append --quiet --output=raw_$2 \
        $1 $loops $threads
  done
done

# Need to calculate stddev, Installing sqlite extension
rm extension-functions.c*
wget http://sqlite.org/contrib/download/extension-functions.c/download/extension-functions.c?get=25
mv extension-functions.c?get=25 extension-functions.c
rm libsqlitefunctions.so
# https://stackoverflow.com/a/16682644/235820
gcc -fPIC -shared extension-functions.c -o libsqlitefunctions.so -lm
cp libsqlitefunctions.so $userhome


sqlite3 -batch $2.db <<EOF
-- create the table
.load ${userhome}/libsqlitefunctions.so
CREATE TABLE experiment (
    cores integer,
    loops integer,
    threads integer,
    real_time real,
    user_time real,
    kernel_time real
);
.separator ","
-- load the data file to the table
.import raw_${2} experiment
-- create a new table with the errors
CREATE TABLE experiment_error AS
    SELECT cores, loops, threads,
        avg(real_time) as avg_rt, stdev(real_time) as std_rt,
        avg(user_time) as avg_ut, stdev(user_time) as std_ut,
        avg(kernel_time) as avg_kt, stdev(kernel_time) std_kt
    FROM experiment
    GROUP BY cores, loops, threads;
EOF

# Write data to new file
sqlite3 -csv $2.db "SELECT * from experiment_error;" > $2

python3 -m pip install --upgrade matplotlib pytz

# Use python to produce plot of results for $CORES
## x -- loops
## y -- time (seconds)
## color -- thread
## dotted --

python3 - <<EOF
import matplotlib
matplotlib.use('Agg')

import matplotlib.pyplot as plt
import os
import pandas as pd
import sys

cores = '${CORES}'
csv_file = '${2}'

# https://pandas.pydata.org/pandas-docs/stable/generated/pandas.read_csv.html
df = pd.read_csv(csv_file, names=['cores',
                 'loops',
                 'threads',
                 'avg_rt',
                 'std_rt',
                 'avg_ut',
                 'std_ut',
                 'avg_kt',
                 'std_kt'])

# split by threads
df2 = df.query('threads == 2')
df4 = df.query('threads == 4')
df8 = df.query('threads == 8')
df16 = df.query('threads == 16')

# https://pandas.pydata.org/pandas-docs/stable/generated/pandas.DataFrame.plot.html
title = "Semaphore addition time for multiple loops and threads on ${CORES}"
df2.plot(x='loops', y='avg_rt', yerr='std_rt',
        title=title, color='red' )
df4.plot(x='loops', y='avg_rt', yerr='std_rt',
        title=title, color='green' )
df8.plot(x='loops', y='avg_rt', yerr='std_rt',
        title=title, color='blue')
df16.plot(x='loops', y='avg_rt', yerr='std_rt',
        title=title, color='yellow' )

# https://matplotlib.org/api/_as_gen/matplotlib.pyplot.fill_between.html
plt.fill_between(df2['loops'],
                 df2['avg_rt'] + df2['std_rt'],
                 df2['avg_rt'] - df2['std_rt'],
                 interpolate=False,
                 color='red',
                 alpha=0.2)
plt.fill_between(df4['loops'],
                 df4['avg_rt'] + df4['std_rt'],
                 df4['avg_rt'] - df4['std_rt'],
                 interpolate=False,
                 color='green',
                 alpha=0.2)
plt.fill_between(df8['loops'],
                 df8['avg_rt'] + df8['std_rt'],
                 df8['avg_rt'] - df8['std_rt'],
                 interpolate=False,
                 color='blue',
                 alpha=0.2)
plt.fill_between(df16['loops'],
                 df16['avg_rt'] + df16['std_rt'],
                 df16['avg_rt'] - df16['std_rt'],
                 interpolate=False,
                 color='yellow',
                 alpha=0.2)

plt.ylabel('Time (s)')
plt.xlabel('Loops')

plt.legend(['Threads 2', 'Threads 4', 'Threads 8', 'Threads 16'],
           loc='upper left')

# Save the two figures
plt.savefig("{}_rt.png".format(csv_file), bbox_inches='tight')
plt.savefig("{}_rt.pdf".format(csv_file), bbox_inches='tight')
EOF
The script uses some python scripting, database scripts, and command-line to help generate experiment result graphs.
Examining the code may be helpful for you, but you only need to create a script (runtest.bash) and run it.
You may decide on how to compile and execute the file the thread_incr_psem.c file.
Understanding the Script and Ouput Files
The output of the code is an sqlite database file (*.db), pdf and png plots of the run, and the csv of the experiments with runs averaged and the standard deviation computed.
There is an additional csv file that is prefixed with raw and the name of your program; this file contains a row for each run of your program, it has the following format:
| total cores | loop size | threads count | real_time average | real_time std deviation | user_time average | user_time std deviation | kernel_time average | kernel_time std deviation | | — | — | — | — | — | — | — | — | — | | - | - | - | - | - | - | - | - | - |
Note: the script only plots the real time. You should still understand the difference between real time, user time, and kernel time. This difference is discussed in your textbook. You may also look for other resources for additional explanations. You can use this script to run the code and produce graphs your experiments. The script above will only execute that code, compute timings, and create graphs.
Viewing the Graphs
To view and download the graphs that are created in your instance, you can create a small Python file server with one command line. This way you can point to the web browser and download the processed files. You will need to open the ports on the google cloud server. Be careful, this is a security risk.
# Creates a simple file server.
# View by pointing browser to https://<external ip>:8889
python3 -m http.server 8889
Another option, is to use the ssh download feature in the cloud indow.

You can push your files back to your GitHub repo and view the files in the browser. You will need to understand the results in order to write the report.
Submission
Create a private Github repository called cs3113fa22-assignment6.
It is important that this repository remains private to avoid any inadvertent academic dishonesty violations.
You will need to add cegme, jasdehart, and farabee738 as collaborators; you can do this in on the GitHub website for your code going to Settings > Manage Access.
You will submit a link to your GitHub repository to Gradescope. When you have submitted, you can use the command line and GitHub to tag your submitted version as 1.0 If you make changes after submitting, you must re-submit on gradescope to make sure we grade your most up-to-date files.
Your repository should have, at least, the following files:
/cs3113fa22-assignment6
├── .gitignore
├── imgs/
├── thread_incr_psem.c
├── README.md
└── COLLABORATORS
imgs
imgs is the name of the folder where you will store your pdf and png plots in.
To do so, you must create the directory and edit the savefig location in the runtest.bash file.
thread_incr_psem.c
Mandatory file to be included in repo. The code is available on the book website thread_incr_psem. It is also available as a single file thread_incr_psem.c. As mentioned above, you will have to change the code so it creates multiple threads.
README
To create the README, run the code and observe the plotted results. Peruse the trends that appear in the across the graphs. Include anything that surprised you.
To help guide your README, use the checklist below:
- A description of how you modified and compiled your code.
- A set of all the assumptions made to run the code.
- Any bugs or corner cases you have handled.
- Definition of semaphores.
- Definitions of “real time”, “kernel time”, “user time”.
- Include plots from the results.
- Descriptions of trends of the plots.
- Explanation of the trend results.
Here is a template readme that you may use
Bonus
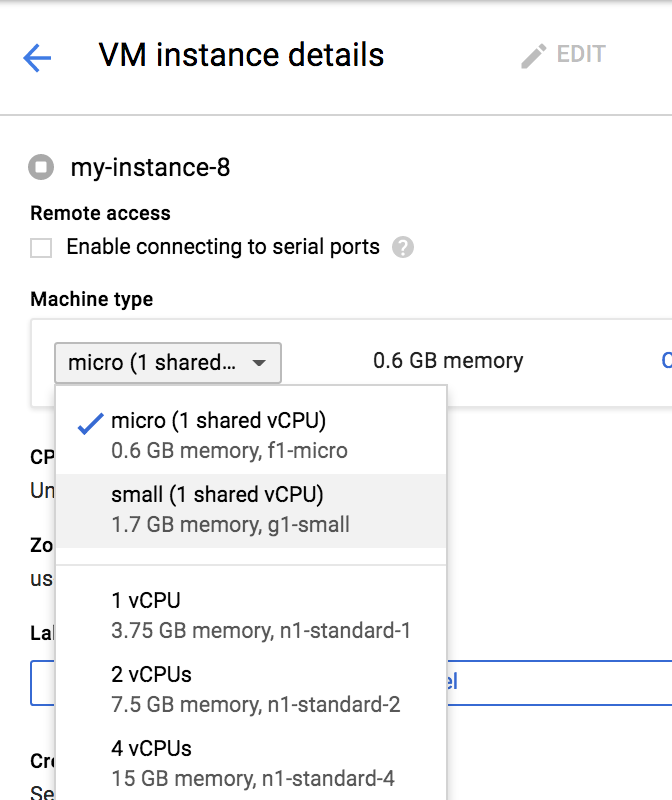
Create three additional vm instances with cores of size 4, 8, and 16. Run the same scripts on all four machine configurations. Plot and report the results. Be careful not to leave these large instances running for a long period of time.
COLLABORATORS file
This file should contain a pipe separated list describing who you worked with and a small text description describing the nature of the collaboration. This information should be listed in three fields as in the example is below:
Katherine Johnson | kj@nasa.gov | Helped me understand calculations
Dorothy Vaughan | doro@dod.gov | Helped me with multiplexed time management
Stackoverflow | https://example | Helped me with a compilation bug
Deadline
The late policy of the course will be followed.
Grading
Grades will be assessed according to the following distribution:
| Task | Percent |
|---|---|
| Code created correctly | 25% |
| Write-up includes full discussion | 75% |
| Bonus discussion | 20% |
| Total | 120% |
Reconfiguring your instance
Note: You can edit the machine configuration on the vm configuration screen.
```
Back to CS3113 Assignments