Gerrymandering
Written by: Shine Xu
Gerrymandering has become a hot topic, and could impact elections. I start to explore the concept in general ways such as searching in google and youtube. The information from those medias provides the basic and rough knowledge that I will discuss it in the first section. In order to obtain more insights, I read a fascinating paper1 from Dr. Chen. The paper manifests how a political scintist studies in this area and which tools and data are used for this topic.
Introduction of Gerrymandering
Gerrymandering is the action of manipulating the electoral district’s shape to generate excessive benefits for a party, group, etc (see Figure 2 below). There exist various types of gerrymandering. If considering human factors, we can categorize it to intentioanl/unitentional gerrymandering. The view point could be applied to whom the gerrymandering is aimed at favoring, and we can look into partisan/racial gerrymandering.
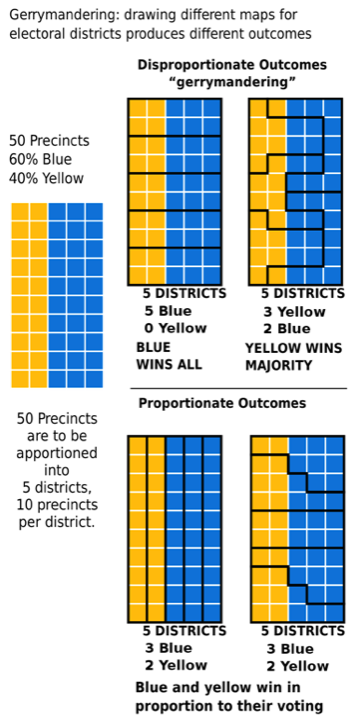
Packing and cracking
There are the two elements of gerrymandering: paching and cracking. If you try to keep your party’s power, you can pack as many opponent’s voters as possible into a single district. If the rivalry candidate has a very high vote share in a district, that means some of his votes are wasted. In the other hand, you can crack your rivalry candidate’s areas into separate districts where there are slightly more your party votes, consequently your opponent party would lose in those districts.
What are the rules?
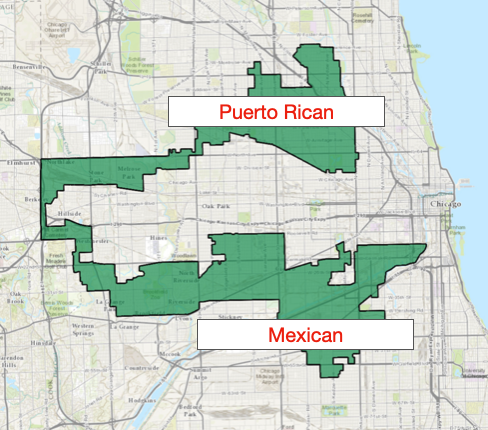
Based on Moon Duchin’s youtube lecture 3, there are multiple rules for redistricting. Each district should have similar or equal population. Contiguity is an important rule that requires hole-free region and connected areas. Compactness means that districts should have reasonable shape and residents living in a district generally live near each other from the same district. Furthermore, avoiding splitting conties, cities and communities of interest also should be considered for redistricting. Last but not least, the opportunity for minority groups should not be harmed by drawing lines. Keeping all those rules is a tough and impossible task, and sometime we see a trade-offs among those rules. For example, Illinois’s 4th congressional district was created after federal courts ordered the creation of a majority-Hispanic district that packs two majority Hispanic parts, meanwhile it generated an incompact shape.
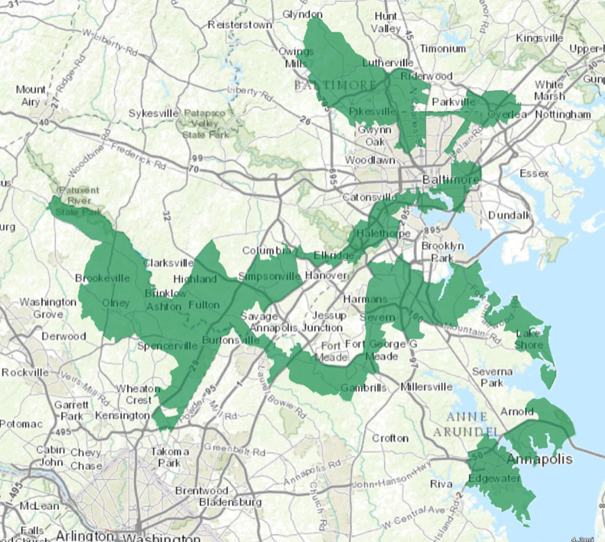
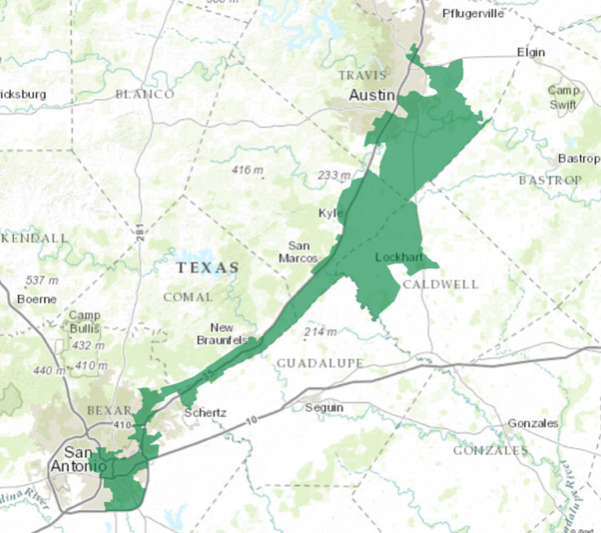
We also see other gerrymandering examples such as Maryland’s 3rd and Texas’s 35th congressional districts. Those districts have irregular shapes.
Unintentional Gerrymandering1
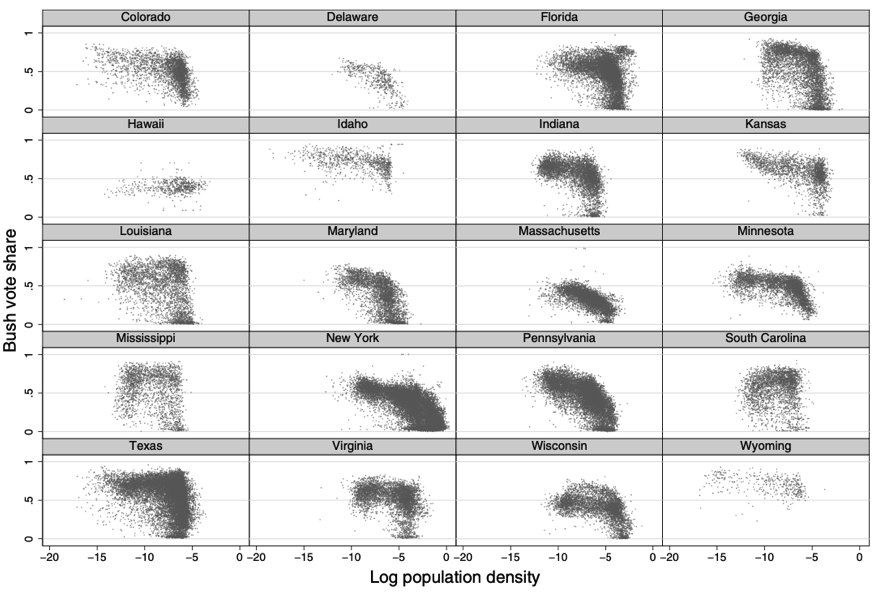
Dr. Chen used the 2000 year’s precinct-level presidential election data to reveal and measure the unintentional gerrymandering. He showed the population density and Bush vote share in 20 states.
The chart conveys that Democrats is highly clustered in densely populated city and graduately become rare in rural areas. And this relationship is more obviuos in the states like Massachusetts and New York. In Mississippi and South Carolina, the pattern disappeared. The paper mentioned that many of the densely populated urban precincts are close to each other.
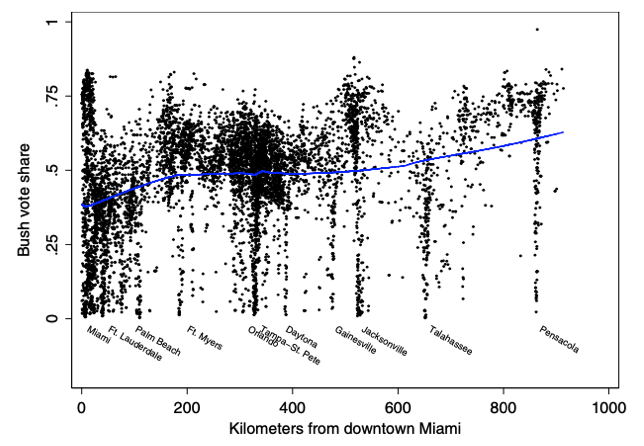
The spatial relationship with partisanship is shown in figure below. We can find that Democrates are more clusters, and Democratic has more precincts which received extremely high vote share. In geographically, Democratic precincts show the pattern that they tend to be closer to each other than Republican precints. The shape like stalactites in the figure suggests this pattern.
Automated Districting and Electoral Bias
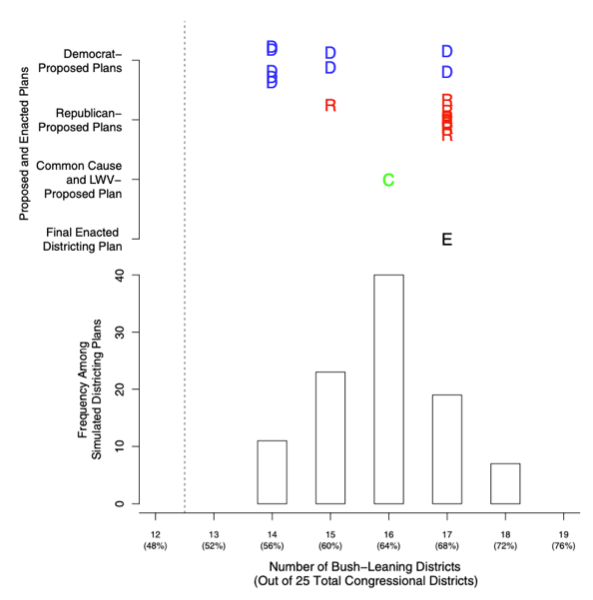
In a two-party system, the normative premise is that a party with 50% of the votes should receive the same proportion of the seats. The simulations kept the traditional districting criteria (e.g., geographic contiguity and compactness), and applied hte partisan-blind manner. The goal is to estimate the electoral bias that would occur under hypothetical distrcting proposals that are unintentionally gerrymandered.
Findings
The study shows multiple findings. First, the distribution of seat shares produced under simulations suggests the significant pro-Republican bias resulting from a districting procedure that is partisan-blind. Second, political geography indicates patterns that pro-Democratic rural precincts are often subsumed into moderately Republican districts and Democratic precincts tend to be assigned to extremely Democratic districts. Third, due to political considerations, the level of bias produced in proposed plans and enacted plan is not significantly different from that produced by human geography alone.
Conclusion
From the study, I summarized some takeaways. President election data can be used for assessing redistrciting plans. For gerrymandering study, researchers may consider both enacted maps, proposed maps and simulated maps. There exists a strong pattern illustrating the relationship between the geographic concentratoin of Democratic voters and electoral bias favoring Republicans. Unintentional gerrymandering won’t necessarily vanish in the redistricting plans regardless of intentional partisan and racial gerrymandering. It is hard to identify an intentional partisan or racial gerrymandering, therefore we may need to compare with neutral redistricting plans.
-
Chen, Jowei, and Jonathan Rodden. “Unintentional gerrymandering: Political geography and electoral bias in legislatures.” Quarterly Journal of Political Science 8.3 (2013): 239-269. ↩ ↩2
-
https://en.wikipedia.org/wiki/Gerrymandering ↩
-
Political Geometry: The Mathematics of Redistricting https://www.youtube.com/watch?v=pi_i3ZMvtTo&list=LL&index=1 ↩