Tricky parts of building a D³.js visualization system
Written by: Shine Xu
Recently, I studied D³ systematically based on Curran Kelleher’s course video and reread the paper: D³ data-driven documents1. Based on the study, I started rethinking how to design visualization systems and how to reconstruct our lab research systems.
Using Arrow Function and other Features
Curran starts the courses from the introduction to Javascript. The Javascript is using ECMAScript 6 or ES6 which is a new standard. In the new ES6, a function definition can be a binding where the value is assigned to a function. For example:
    const square = function(x) {
        return x * x;
    };
The function can use an arrow (=>) replace the the funciton keyword:
const square = (x) => x * x;
Further simplified, the syntaxunction will look like:
const square = x => x * x;
Also, if there are multiple statements inside the function, we can use the curly braces to include them:
    const square = x => {
        const result  x * x;
        return result;
    }
We see this new style in the D³ examples. From a visualization systems building perspective, the arrow function can be embedded in visual idioms’ property setting. The advantage is that the arrow function makes the code succinct, on the other hand, it could exacerbate the expressiveness for those not familiar with it.
Check your parameters
Next, Curran talked about SVG scalable vector graphics. SVG encodes every shape separatley and uses group elements to combine multiple shapes. The SVG is a scalable image format; it is different than JPEG or other image formats. This means no matter how much zoom in, it will not be blurry. Different shapes have different attributes, for example, a circle uses cx/cy to define the center position, but a rectangel uses x/y to allocate its left top corner. The path shape will have default fill color, so it is better to set the fill color to none for visualizing a path.
These are the fundamentals for building a visual chart, we need to consider different coordinates systems and aesthetics after we can draw lines, dots, and shapes. D3 provides multiple scaling functions. Scaling functions let users match the data space into the screen space.
Other ES6 Feaures
D³ stands for data-driven documents. It is a javascript library and let us to create visualization in the browser. Curran uses import feature for the function in d3 library:
    import { select, range } from 'd3';
    import { fruitBowl } from './fruitBowl';
The import feature allows us to make our code more reusable now. We define many global variables in our system, but those variables are not used in every file. We can import a function or a variable from another file. After reading the csv file, we always see the data converting code using only a + to convert string to float, this style is initially confusing.
    csv('data.csv').then(data => {
        d.population = +d.population;
    });
Considering General Update Module
The D³ data .join function uses three features enter, update, and exit to communicate between data and the document object elements. These features plays an important role for efficient dynamic visualizations. D³ data join looks like figure below.
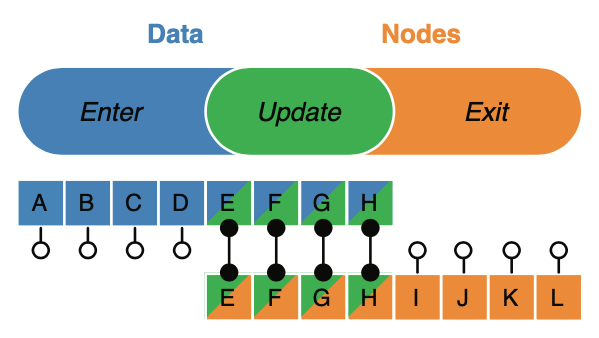
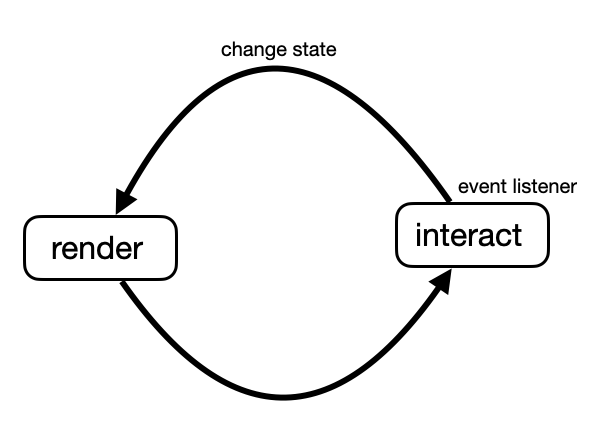
On one side, there is data which is input data array, and the other side is nodes which are DOM elements. The D³ join deals with three separate cases: enter, update, and exit. The enter operator will create placeholder nodes for the incoming data array, and the exit returns elements related to deleted data. The update is the case where there exist both DOM elements and data elements, and they correspond to each other already. The update selection does not require having a key to update in the code. The merge operator combines enter and update selection. For building a visualization system, interaction features (e.g., filtering, selecting, ordering) play an important role to improve the capability of performing analytical tasks. When users interact with the system, dynamic changes in the visualization are expected. There are fewer examples in D³ using the general update module, maybe because the author for those examples only consider a single visual technique rather than a comprehensive system. If you want to build a visualization system, interactions should be considered, and the update module will help with the interaction. I had a bad experience when I first time built a visualization, I learn everything about D³ in those examples from google searching therefore I even don’t know the existence of the general update module. Consequently, when implementing an interaction feature, I always delete the components in the visualization and then create a new one. For example, when I need to update a scatterplot based on some interaction, I deleted the current scatterplot and then create a new scatter plot based on the information from the user interaction. This is a waste if a small amount of changes occurs. In Curran’s tutorial, he described the interaction as a unidirectional data flow shown in the figure below. An event listener is waiting for an interact. Once the interacton is made, it changes state which the information changed from the user interaction. Last, the system renders the changed state to the visualization and this step is using the general update module to change the visualization.
Applying Object-Oriented Programming
Last but not least, ES6 introduced classes to support object-oriented programming that will make the code reusable. We should consider creating classes including constructor, initial visualization function, and update visualization function. This could avoid redrawing the visualization after some interaction.
class Scatterplot{
    constructor() {
        this.initialScatterplot();
    }

    initScatterplot() {
        //initialize
    }

    updateScatterplot() {
        // update
    }
}
A critical task is how to generalize each visualization into class. And later, the minor difference in the visualization will not make the created class imcompatible. But from a visualization system perspective, the object-oriented style helps to organize the different visual idioms. Furthermore, we need better modulization because we might want to add new modules to the system and make the system more flexible. From the code organization angle, modularization and object-oriented style can strengthen the code reusability.
Conclusion
Building a visualization system can benefit from arrow function, general update module and object-oriented programming. We will keep developing learnability when we apply those features. Also, some features may rely on the settings in your computer; for example, does your browser support ES6? Our future work will apply the techniques above into our system and make them more powerful. We will see how many lessons that we will learn from our next step and would like to share more from our new experience.
-
Bostock, Michael, Vadim Ogievetsky, and Jeffrey Heer. “D³ data-driven documents.” IEEE transactions on visualization and computer graphics 17.12 (2011): 2301-2309. ↩